Why a Three-Month Bill Pays More Than the Fed's Rate
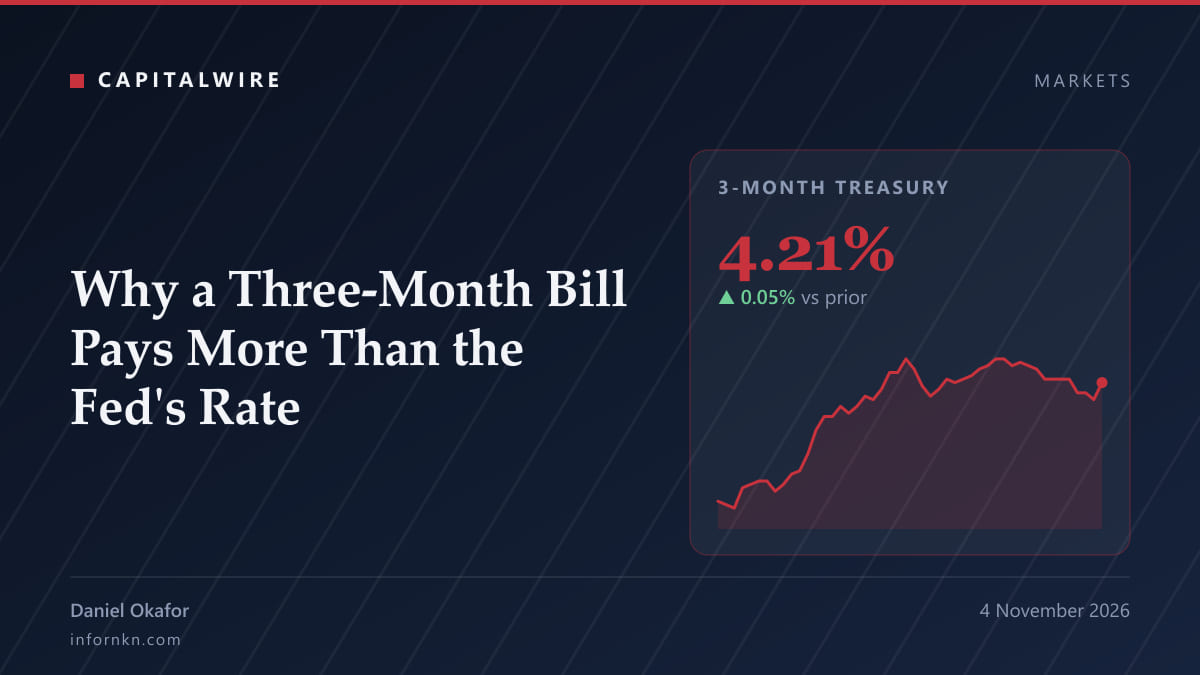
The bill yields 4.21%, the effective funds rate 3.88%. The 33 basis-point gap prices hikes or supply.
The three-month Treasury bill yields 4.21%, and the effective federal funds rate averaged 3.88% in October. The bill pays 33 basis points more than the rate the Federal Reserve sets. That gap is not free money. A bill matures in three months, so its yield has to reflect what the overnight rate is expected to average over the holding period. When the bill pays more than the current rate, its buyers expect the rate to rise.
The instrument forces the arithmetic. A bill is bought at a discount and repays par, so the buyer's return is locked at purchase and cannot reset. Choosing a bill over rolling overnight funding means giving up the right to reprice higher if policy moves. The discount is where that right is paid for, which is why the bill curve leads the policy rate instead of following it.
Both legs moved in 2026, but not equally. The bill is 56 basis points above its first close of the year, while the effective funds rate is 24 basis points above its January level. The spread widened rather than closed, so the market added more tightening to the next three months than the committee delivered.
The rest of the curve agrees. The two-year yields 4.59%, 38 basis points above the bill, and the ten-year at 4.91% sits 70 basis points above it. A curve that slopes upward from three months to ten years prices a policy rate that is higher on average over two years than over three months, and higher again over a decade. That is a path, not a meeting.
A forecast is not the only thing being priced. Bill yields also have to clear the market for bill supply, and a heavier bill calendar widens the discount needed to place the paper. On a chart, a spread widened by supply and a spread widened by expectations look identical and are different facts. The order of events separates them: expectation-driven widening builds before a meeting and unwinds after it, while supply-driven widening does not.
What would break this reading: a meeting that ends with no change in the target range while the bill keeps trading 33 basis points above the effective rate. That combination would make the gap a supply or year-end technical story, and the policy-forecast interpretation above the wrong one.
Elsewhere
- 3-Month Treasury Bill Secondary Market Rate, Discount BasisFRED
Daily, from the H.15 release. The series behind every bill figure here; read the discount-basis note on the page before comparing it with a coupon yield.
- Federal Funds Effective RateFRED
Monthly averages rather than daily prints, which is why the comparison here pairs a daily bill quote with the October average.
- H.15 Selected Interest RatesFederal Reserve
The primary release both series are drawn from. Published every business day at 4:15pm, one day after the observations it covers.
Sources
- FRED series DGS3MO, 3-Month Treasury Bill Secondary Market Rate, observed 2026-11-02; https://fred.stlouisfed.org/series/DGS3MO
- FRED series FEDFUNDS, effective federal funds rate, monthly average, October 2026; https://fred.stlouisfed.org/series/FEDFUNDS
- Federal Reserve, H.15 Selected Interest Rates, release of 30 October 2026; https://www.federalreserve.gov/releases/h15/
- Federal Reserve, FOMC statement, 16 September 2026
More from CapitalWire

The 10-Year's 2026 Rise Is a Real-Rate Story
Nominal yields are up 79 basis points this year. Real yields account for 69 basis points of that, inflation expectations for 9.

Treasury Curve Flattens as Jobs Data Pulls December Hike Odds to 68%
Two-year Treasury yields fell six basis points to 4.61% and ten-year yields slipped seven to 4.98% after October payrolls undershot, leaving the 2s10s spread near 37 basis points as December Fed hike odds eased from 78% to roughly 68%.

Treasury Market Reprices as Inflation Expectations Slip Below 2.3%
Long-dated U.S. government bonds have rallied sharply, pulling ten-year yields below 3.6% and breakeven inflation to a two-year low.
Reader discussion